Refer to the scatter diagram below. The diagram suggests which of the following?
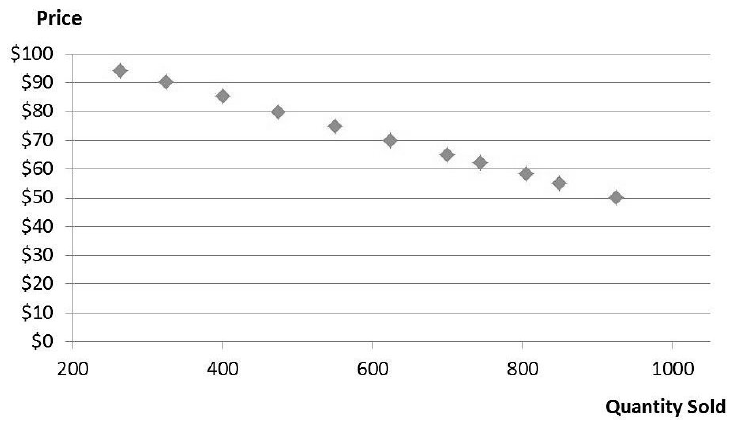
The scatter diagram above shows the actual data for the price and quantity demanded of a product.
A) The true demand is likely to be linear it the natural logarithms.
B) The estimated demand curve will have a positive slope.
C) A straight-line demand curve will likely be the best fit.
D) A nonlinear demand curve will likely be the best fit.
C) A straight-line demand curve will likely be the best fit.
You might also like to view...
Which of the following factors is most responsible for the return of extended-family households among American communities?
A) religious fundamentalism and a return to traditional values B) population pressure and the associated housing crisis C) young adults remain in the home longer, but have their own children earlier D) economic hardship coupled with a rising divorce rate
According to comparative linguists Joseph Greenberg and Merritt Ruhlen, there were
three waves of migration into the New World. Indicate whether the statement is true or false
Despite the differences among theoretical paradigms of practitioners as varied as Harris (cultural materialism), White (general evolution), Steward (cultural ecology), and Mead (configurationalism), all of them have what in common?
A. a strong sense of determinism, leaving very little (if any) room for the exercise of individual human agency B. a well-founded suspicion of the claims of science C. an embrace of reflexive anthropology D. a sense of moral duty to help the people they studied to accelerate their path to civilization E. a strong concern for the future of anthropological education
The word cat is a symbol.
Answer the following statement true (T) or false (F)