Of the collection of supply and demand diagrams in Figure 2.2, which one shows the result of a decrease in the population of the group of people likely to buy a good?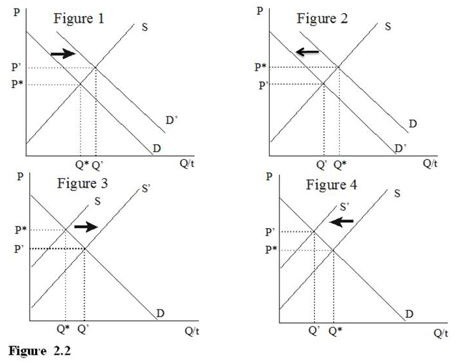
A. Figure 1
B. Figure 2
C. Figure 3
D. Figure 4
Answer: B
You might also like to view...
From the perspective of economic theory, prices are basically
A) constant. B) information signals C) rising. D) rates of exploitation.
Discuss the BRAC model and evaluate its performance in achieving the goals of economic development? Can this model be replicated in other countries?
What will be an ideal response?
Which of the following provides the best explanation of why low-income countries generally remain poor?
a. Their institutional arrangements and policies often discourage productive activity and reduce the potential gains from specialization and exchange. b. They are oppressed by developed nations that benefit from the cheap goods available from countries with low wage rates. c. They are poorly endowed with natural resources, which are essential for long-term rapid growth. d. When the average income level is low, workers have little incentive to earn higher incomes.
A government surplus has the effect of :
a. Increasing the demand for real loanable funds, increasing the real risk-free interest rate, and increasing the quantity supplied of real loanable funds per period. b. Increasing the supply of real loanable funds, reducing the real risk-free interest rate, and increasing the demand for real loanable funds. c. Decreasing the supply of real loanable funds, increasing the real risk-free interest rate, and decreasing the quantity demanded of real loanable funds per period. d. Decreasing the supply of real loanable funds, increasing the real risk-free interest rate, and decreasing the demand for real loanable funds per period. e. Increasing the supply of real loanable funds, reducing the real risk-free interest rate, and increasing the quantity demanded of real loanable funds per period.