Sketch the graph of the line by locating the second point with the rise-and-run method.Through (0, 2), m = 

A. 
B. 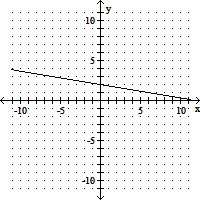
C. 
D. 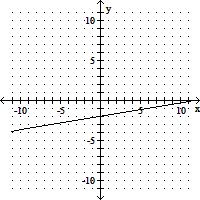
Answer: A
You might also like to view...
Use the circle graph to answer the question.Last year, one family ate fast food 576 times. The circle graph shows the types of food eaten for the year. Find the number of times fish was eaten.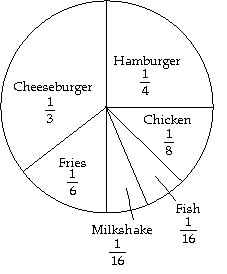
A. 144 times B. 36 times C. 192 times D. 72 times
Multiply and reduce to lowest terms. ?
? 
A.  y
y
B. 
C. 
D.  y
y
Solve the problem.The sales of a new product (in items per month) can be approximated by  , where t represents the number of months after the item first becomes available. Find the number of items sold per month 33 months after the item first becomes available.
A. 4225 items per month B. 2225 items per month C. 45,000 items per month D. 625 items per month
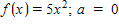
Calculate the average rate of change of the given function f over the interval  , where
 , and
, and  middle;" data-wiris-created="true" varid="variable_id_field" variablename="impvar_0ad927f26b4946aba3ecdcb24" />. (It will be easier to do this if you first simplify the difference quotient (dq) as much as possible.)
 Complete the table.?
h
dq
1
0.1
0.01
0.001
0.0001
?
A. ?dq50.050.00050.0000050.00000005?
B. ?dq50.50.050.0000010.0001?
C. ?dq65.15.015.0015.0001?
D. ?dq50.50.050.0050.0005?
E. ?dq50.50.050.0050.00000001?