The curve that illustrates that higher tax rates could lead to lower tax revenues if economic activity is severely discouraged is called:
A. the Laffer Curve.
B. the Phillips Curve.
C. the aggregate demand curve.
D. the production possibility curve.
Answer: A
You might also like to view...
Use the following figure to answer the question below.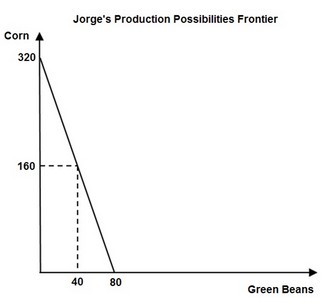 Jorge's opportunity cost of producing 1 pound of green beans is ________ pound(s) of corn.
A. 1/4 B. 4 C. 2 D. 1
Use the following graph to answer the next question. 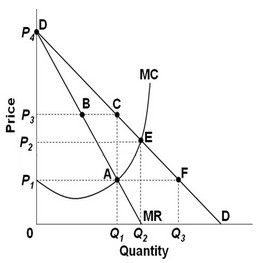 If the industry were served by a pure monopoly, the profit-maximizing price and quantity of output would be ________.
A. P1, Q1 B. P1, Q3 C. P3, Q1 D. P2, Q2
When the price of a movie ticket falls from $14 to $10, the quantity of tickets demanded increases from 500 to 700 a day. What is the price elasticity of demand for movie tickets? (Use the midpoint method.)
What will be an ideal response?
Which of the following is the best example of a nonrenewable resource?
a. Forests. b. Oil. c. Clean air. d. Fish in the ocean.