Exhibit 8-7 Consumption function
?
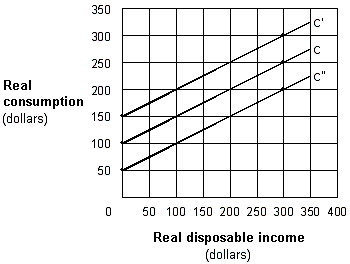
In Exhibit 8-7, the value of the marginal propensity to consume is:
A. high for C' than for C.
B. lower for C" than for C.
C. lower for C" than for C'.
D. the same for C, C', and C".
Answer: D
You might also like to view...
The number of pre- and post-policy visitors, V1 and V2, (in thousands) is ____ and _____, respectively.
A collaborative federal and state program has been proposed in response to acid rain damagein Newport Bay, Maryland. To estimate the incremental benefits of the program, you use thetravel cost methodbasedupon the following pre- and post-policy recreational demand functions: Pre-policy: P = 62 – 0.02V1 Post-policy: P = 80 – 0.02V2, where V is the number of visitors (in thousands) and P is the admission fee. Assume the admission fee is set at $20 per visitor. a. 2,100; 3000 c. 61.6; 79.6 b, 44,100; 90,000 d. none of the above
A decrease in the price of either good will cause a consumer's budget constraint to:
A) pivot leftward. B) pivot rightward. C) shift leftward. D) shift rightward.
In Singapore the government places a $5,000 tax on the buyers of new automobiles. After the purchase of a new car, a buyer must pay the government $5,000. How would the imposition of the tax on buyers be illustrated in a graph?
A) The tax will shift both the demand and supply curves to the right by $5,000. B) The tax will shift the demand curve to the right by $5,000. C) The tax will shift the supply curve to the left by $5,000. D) The tax will shift the demand curve to the left by $5,000.
Use the above figure. Which graph depicts a normal good?
A) A B) B C) C D) D