Refer to the graph below, which shows the market for beef where demand shifted from D1 and D2. The change in equilibrium from E1 to E2 cannot be a result of:
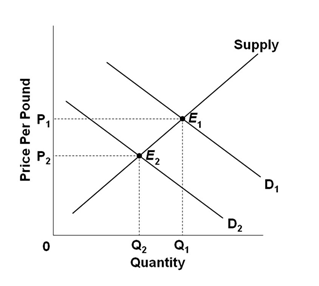
A. Buyers expectations of lower prices for beef in the very near future
B. An increase in the subsidy given to cattle farms
C. A widespread concern about mad-cow disease
D. A decrease in the productivity of cattle farms
D. A decrease in the productivity of cattle farms
You might also like to view...
In the above table, the marginal propensity to save when disposable income changes from $1,000 to $2,000 is
A) 0.1. B) 0.2. C) 0.8. D) -0.2.
The change in fixed costs over the short run is seen in the behavior of marginal costs
Indicate whether the statement is true or false
According to economic analysis, while making a decision, an individual compares the benefits expected from one option with the benefits expected from other options
a. True b. False Indicate whether the statement is true or false
Which of the following provides the best explanation for constant returns to scale?
A. Increasing marginal product B. Diminishing marginal product C. Replication of production techniques D. Constant marginal product