The following table provides data for an economy in a certain year. Consumption expenditures1,000Imports600Government purchases of goods and services700Construction of new homes and apartments500Sales of existing homes and apartments600Exports500Government payments to retirees200Household purchases of durable goods300Begining-of-year inventory500End-of-year inventory600Business fixed investment300Given the data in the table, compute the value of GDP.
A. 2,700
B. 2,400
C. 2,500
D. 2,600
Answer: C
You might also like to view...
Assuming imperfect perfect capital mobility, the BP schedule is
a. vertical. b. horizontal. c. upward sloping. d. downward sloping. e. flat.
Autarky is also known as interdependence among foreigners
Indicate whether the statement is true or false
If the long-run Phillips curve shifts to the left, then for any given rate of money growth and inflation the economy has
a. higher unemployment and lower output. b. higher unemployment and higher output. c. lower unemployment and lower output. d. lower unemployment and higher output.
Refer to the accompanying figure. An increase in demand is represented by a shift from: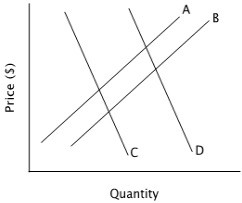
A. curve C to curve D. B. curve D to curve C. C. curve B to curve A. D. curve A to curve B.