Solve the problem.The following data represents the normal monthly precipitation for a certain city in California. 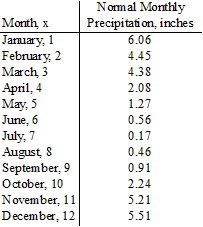 Draw a scatter diagram of the data for one period. Find a sinusoidal function of the form
 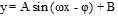 that fits the data. Draw the sinusoidal function on the scatter diagram. Use a graphing utility to find the sinusoidal function of best fit. Draw the sinusoidal function of best fit on the scatter diagram.
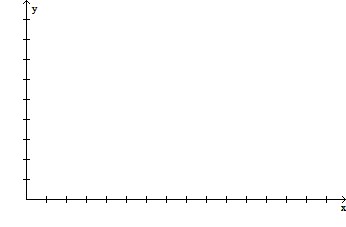
What will be an ideal response?
y = 3.14 sin (0.46x + 1.52) + 3.16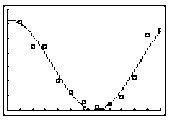
Mathematics
You might also like to view...
Write the rational expression in lowest terms.
A. 
B. 
C. 
D. 
Mathematics
Combine like terms.4y4 - 9y4
A. 5y B. -5 C. -5y4 D. 5y4
Mathematics
Look for a pattern and then predict the general term, or nth term, an, of the sequence.1 ? 4, 2 ? 5, 3 ? 6, 4 ? 7, 5 ? 8, . . .
A. an = n ? n3 B. an = n ? (n + 3) C. an = n ? 3n D. an = n ? 3
Mathematics
Graph the function.f(x) = 
A. 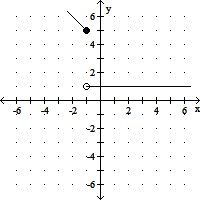
B. 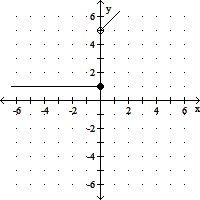
C. 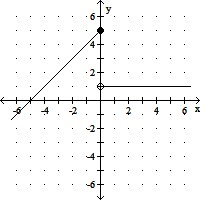
D. 
Mathematics