Evaluate  without using a calculator.
A. 
B. 
C. 
D. 
E. 
Answer: B
You might also like to view...
Graph the polar equation.r = 
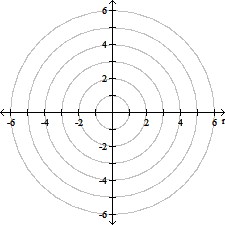
A. 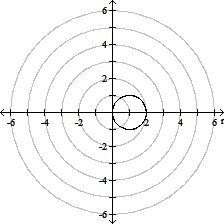
B. 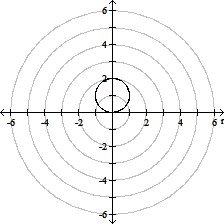
C. 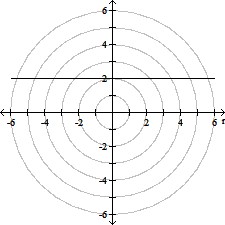
D. 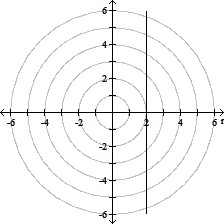
Provide an appropriate response.When tossing a fair coin, which of the following events is more unlikely? A: Getting 60% tails in 10 tosses B: Getting 60% tails in 100 tosses C: Getting 60% tails in 1000 tosses
A. B B. C C. A D. All are equally likely
Solve the problem.In 1992, the population of a country was estimated at 5 million. For any subsequent year, the population, P(t) (in millions), can be modeled using the equation  where t is the number of years since 1992. Determine the year when the population will be 39 million.
What will be an ideal response?
Use the graph of f(x) to solve the inequality.f(x) > 0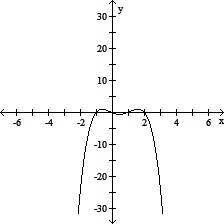
A. -1 < x < 0 or x > 1 B. x < -1 or 0 < x < 1 C. 1 < x < 2 D. -1 < x < 0 or 1 < x < 2