This graph demonstrates the domestic demand and supply for a good, as well as the world price for that good.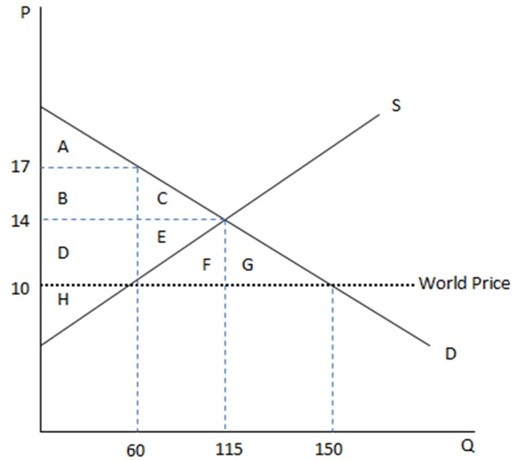 According to the graph shown, if this economy were an autarky, producers would enjoy area:
A. ABC.
B. H.
C. HDE.
D. A.
Answer: C
Economics
You might also like to view...
Unlike nontariff barriers, tariffs
A. are less transparent B. are more transparent C. are neutral
Economics
The Keynesian labor supply function is shown as
a. Ns = g(W/P). b. Ns = g(P/W). c. Ns = t(W/Pe). d. Ns = t(Pe/W).
Economics
By summing the quantities demanded by individuals at each price we obtain the
A) equilibrium price. B) market demand curve. C) market supply curve. D) individual demand curve.
Economics
When wages decrease a. the substitution effect increases the quantity of labor supplied. b. the substitution effect increases the supply of labor
c. the income effect increases the quantity of labor supplied. d. the income effect increases the supply of labor.
Economics