Refer to the information provided in Figure 2.4 below to answer the question(s) that follow.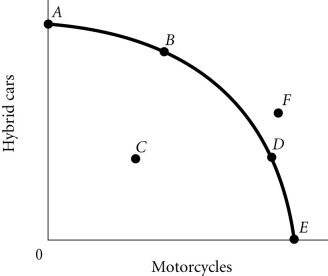 Figure 2.4According to Figure 2.4, a decrease in unemployment may be represented by the movement from
A. B to A.
B. C to D.
C. B to D.
D. A to C.
Answer: B
You might also like to view...
If real GDP exceeds aggregate planned expenditure, then the change in unplanned inventories is ________ and firms ________ production
A) negative; decrease B) positive; increase C) zero; do not change D) negative; increase E) positive; decrease
If there are approximately 5,000 barrels of known reserves of oil, an estimated 7,500 barrels of unknown reserves of oil,
and annual consumption is 500 barrels of oil, approximately how many years will it be until the supply of oil is depleted, all else equal? A) 5 B) 10 C) 15 D) 25
Using the figure above, suppose with no trade Liz and Joe each produce at point A on their respective PPFs. Then, Joe suggests that they specialize and trade. He would produces only salads and Liz would produce only smoothies
Then, Joe says, he would buy 16 smoothies from Liz at a price of 1.5 salads per smoothie. Liz should A) accept Joe's offer since she will gain 4 smoothies and 4 salads. B) accept Joe's offer as she will be as well off as with no trade. C) not accept Joe's offer as the price he offers is too low for her to gain from trade. D) not accept Joe's offer since she would lose 2 smoothies and 2 salads. E) accept Joe's offer since she will gain 4 salads.
An increase in government purchases of $200 billion will shift the aggregate demand curve to the right by
A) less than $200 billion. B) more than $200 billion. C) $200 billion. D) None of the above are correct. This policy shifts the long-run aggregate supply curve.