Using three separate graphs of conventionally-shaped TSB and TSCfunctions show that these values indicate that the regulations outlined in the CAAA of 1990 are (i) efficient; (ii) too lenient; and (iii) too stringent.
According to the EPA’s prospective analysis of the 1990 to 2010 period, total social benefits (TSB) associated with the CAAA of 1990 are estimated at $690 billion ($1990) and the comparable total social cost (TSC) estimates are $180 billion ($1990).
Three hypothetical depictions of the TSB and TSC estimates are shown below.
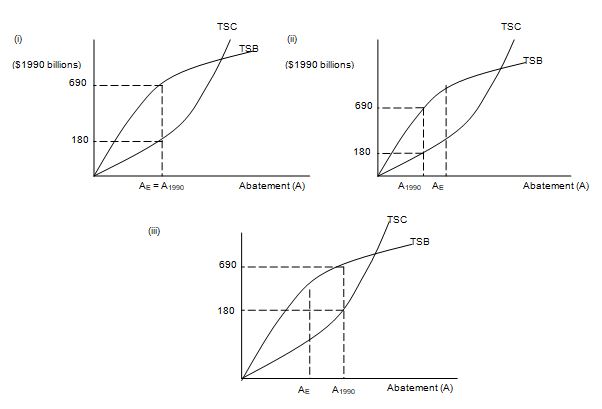
Notice that in all three cases, at the 1990 level of abatement A1990, the TSB of $690 billion are higher than the TSC of $180 billion. What differs across the three diagrams is the location of A1990 relative to the efficient level of abatement, AE.
In Figure (i), A1990 is equal to AE, since at this point, the slope of TSB is equal to the slope of TSC, meaning that the vertical distance between TSB and TSC is maximized. In Figure (ii), A1990 is to the left of AE, indicating that too little abatement has been legislated, i.e., the 1990 Amendments are too lenient. Just the opposite case is depicted in Figure (iii), where too much abatement is imposed by law, i.e., the 1990 Amendments are too stringent.
You might also like to view...
If the calculated price elasticity of demand between two points is -4, demand is
A) inelastic. B) elastic. C) unresponsive to price. D) unit-elastic.
An economy that has many unemployed workers and idle factories is not operating efficiently
a. True b. False Indicate whether the statement is true or false
Which of the following is NOT something a macroeconomist would study?
What will be an ideal response?
Refer to the information provided in Figure 2.4 below to answer the question(s) that follow.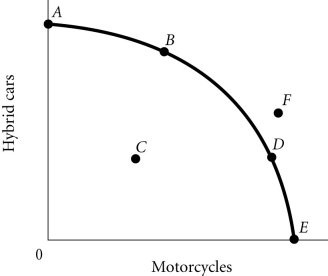 Figure 2.4According to Figure 2.4, Point E necessarily represents
A. only motorcycles being produced. B. overallocation of resources. C. an impossible production point. D. technological advancement.