Exhibit 7-14 Cost curves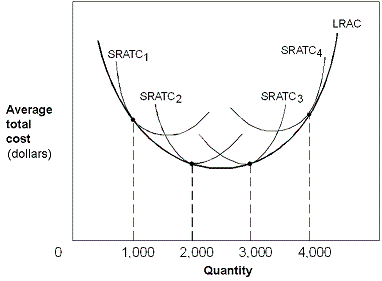
In Exhibit 7-14, the U-shaped LRAC curve indicates which of the following as quantity increases from 0 to 4,000?
A. Diseconomies of scale; constant returns to scale; economies of scale.
B. Constant returns to scale; economies of scale; diseconomies of scale.
C. Economies of scale; constant returns to scale; diseconomies of scale.
D. Economies of scale; diseconomies of scale; constant returns to scale.
Answer: C
You might also like to view...
Assume the capital-labor ratio remains constant. If investment increases at a constant rate, real GDP per worker will increase ________, and if total factor productivity increases at a constant rate, real GDP per worker will increase ________
A) at an increasing rate; at an increasing rate B) at a constant rate; at an increasing rate C) at a constant rate; at a decreasing rate D) at a decreasing rate; at a constant rate
Which of the two bonds in each example would you expect to generally pay the higher interest rate? Explain why
a. a U.S. government bond or a Venezuelan government bond b. a U.S. government bond or a municipal bond with the same term and issued by a creditworthy municipality. c. a 6-month Treasury bill or a 20-year Treasury bond d. a Microsoft bond or a bond issued by a new recording company
Cyclical unemployment is:
A. the effect of wages remaining persistently above the market-clearing level. B. unemployment caused by short-term economic fluctuations reflected in GDP growth. C. unemployment caused by workers who are changing their location, job, or career. D. unemployment resulting from a mismatch between the skills workers can offer and the skills demanded.
As a percentage of GDP, U.S. exports are:
A. greater than U.S. imports. B. about 20 percent. C. considerably lower than in several other industrially advanced nations. D. higher than in Canada but lower than in Germany.