Solve the problem.Suppose that the population of a certain city during a certain time period can be modeled with the function, P(x) = -0.1x5 + 3.6x4 + 5000, where x is time in years since 1960. By sketching a graph of P(x), estimate during what time period the population of the city was increasing.
A. Between 1960 and 1989
B. Between 1989 and 1996
C. Between 1960 and 1974
D. Between 1965 and 1989
Answer: A
Mathematics
You might also like to view...
Simplify the radical expression.
 ?
?
A. 
B. 
C. 
D. 
E. 
Mathematics
Write a linear equation in three variables that is satisfied by the given ordered triples.(0, 0, 2), (7, 7, 0), (14, 0, 0)
A. x + 7y + z = 14 B. x + y + 7z = 14 C. x + y + z = 7 D. x + y + z = 14
Mathematics
Solve. +
+  =
= 
A. 3 B. 7 C. 7, 2 D. -7, -2
Mathematics
Graph the equation.y =  + 1
+ 1
A. 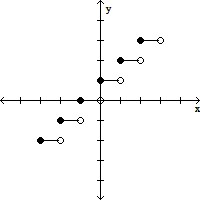
B. 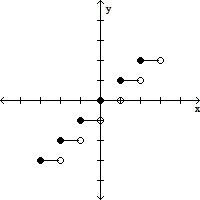
C. 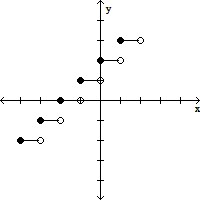
D. 
Mathematics