 Refer to the above graph. The ratchet effect would suggest that:
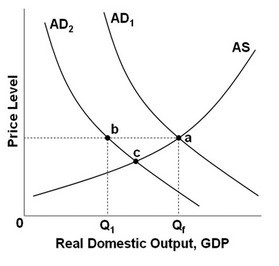
A. if AD1 moves to AD2, the new equilibrium would be at c.
B. if AD2 moves to AD1, the new equilibrium would be at a.
C. if AD1 moves to AD2, the new equilibrium would be at b.
D. if AD2 moves to AD1, the new equilibrium would be at b.
Answer: C
You might also like to view...
Refer to Figure 13-1. Ceteris paribus, a decrease in interest rates would be represented by a movement from
A) AD1 to AD2. B) AD2 to AD1. C) point A to point B. D) point B to point A.
A decrease in real GDP can
A) shift money demand to the right and increase the interest rate. B) shift money demand to the left and increase the interest rate. C) shift money demand to the right and decrease the interest rate. D) shift money demand to the left and decrease the interest rate.
The above figure shows four different markets with changes in either the supply curve or the demand curve. Which graph best illustrates the market for computers after technological advances in making computers occur?
A) Graph A B) Graph B C) Graph C D) Graph D
Using Figure 1 above, if the aggregate demand curve shifts from AD3 to AD2 the result in the long run would be: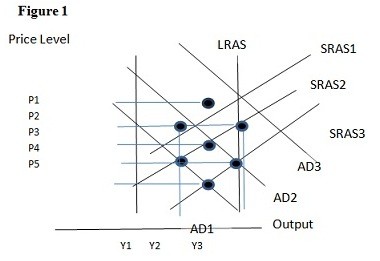
A. P1 and Y2. B. P2 and Y1. C. P3 and Y1. D. P3 and Y2.