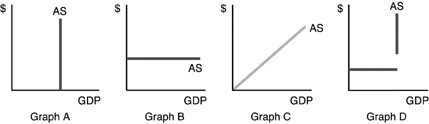
 Refer to the above figure. Which of the graphs is consistent with the Keynesian short-run aggregate supply curve?
A. Graph A
B. Graph B
C. Graph C
D. Graph D
Answer: B
You might also like to view...
What is the poverty line in the United States based on?
a. The average purchasing power of a family of three b. The average standard of living in the United States c. Three times the cost of a nutritionally adequate diet d. The cost of housing and food in each state
The growth rate of potential GDP is the sum of the growth rates of
a. labor force and population. b. labor force and labor productivity. c. labor force and capital stock. d. labor productivity and capital stock.
A firm producing cans buys three tons of aluminum per day at $200 per ton. If it buys four tons per day, it receives a quantity discount on all units and pays only $175 per ton. The marginal cost of the fourth ton per day is
a. $100. b. $175. c. $700. d. $225.
You have driven 800 miles on a vacation and then you notice that you are only 15 miles from an attraction you hadn't known about, but would really like to see. In computing the opportunity cost of visiting this attraction you had not planned to visit, you should include
a. both the cost of driving the first 800 miles and the next 15 miles. b. the cost of driving the first 800 miles, but not the cost of driving the next 15 miles. c. the cost of driving the next 15 miles, but not the cost of driving the first 800 miles. d. neither the cost of driving the first 800 miles nor the cost of driving the next 15 miles.