Refer to the following graphs to answer the question below.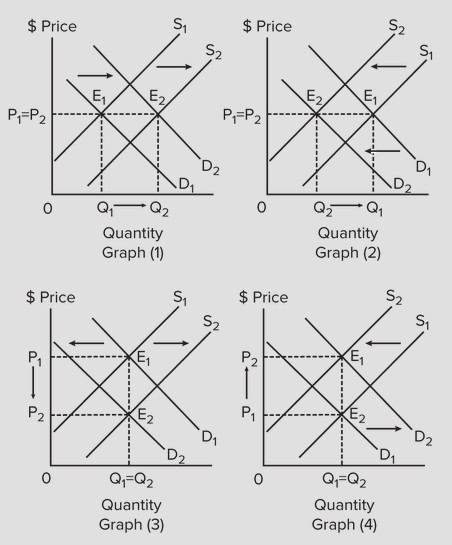 Select the graph above that best shows the changes in demand and supply in the market for music CDs sold in stores, if more consumers switch to music-downloads from the Internet, and the cost of making music CDs decreases because of technological improvement in production.
A. graph (1)
B. graph (2)
C. graph (3)
D. graph (4)
Answer: C
You might also like to view...
The tax multiplier is negative because increases in taxes lead to decreases in consumer spending
Indicate whether the statement is true or false
Gross Domestic Product is best described as the
a. measure of a nation's total economic welfare. b. national income, including nonmarket income. c. sum of money values of all final output produced in the domestic economy within the year. d. national output minus environmental damage.
Which of the following middle-income countries had higher fixed and mobile lines per 1,000 people, than the U.S. and Japan in 2009?
a. Brazil b. Russia c. China d. India
Refer to the graph shown. If the firm wishes to double output from 500 to 1,000: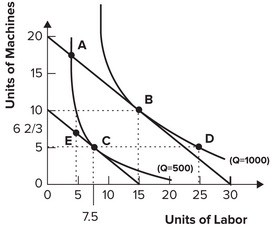
A. average total costs will rise. B. average total costs will remain the same. C. average total costs will fall. D. it is impossible to determine what will happen to average total costs.