Solve the problem.Suppose that the speed of a car, measured in miles per hour (mph), is monitored for some short period of time after the driver applies the brakes. The following table relates the speed of the car to the amount of time, measured in seconds (sec), elapsed from the moment that the brakes are applied.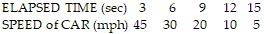 Represent the data in the table graphically with elapsed time on the horizontal axis and speed on the vertical axis. Would a linear function give an approximate fit?
What will be an ideal response?
A linear function does not give an approximate fit.
You might also like to view...
Describe how to transform the graph of f into the graph of g.f(x) =  and g(x) = 4
A. Horizontal scaling by a factor of 4
B. Vertical scaling by a factor of 4
C. Vertically scaling by a factor o 
D. Horizontal scaling by a factor of 
Find log  .
.
A. -.022 B. 0.68 C. -0.68 D. 0.22
Solve the problem. Round rates to the nearest tenth of a percent, dollar amounts to the nearest cent, and time to the nearest day.Leon Harding receives proceeds of $5,095 after signing a 180-day note for $5,400. Find the discount rate.
A. 11.7% B. 11.3% C. 11.6% D. 15.3%
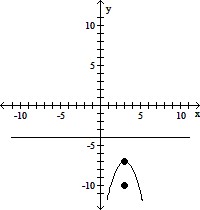
Find the vertex, focus, and directrix of the parabola. Graph the parabola.y2 - 6y + 12x + 93 = 0
A. vertex: (3, -7)
focus: (3, -4)
directrix: y = -10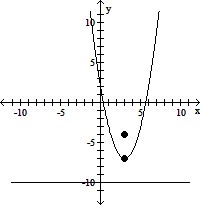
B. vertex: (-7, 3)
focus: (-10, 3)
directrix: x = -4
C. vertex: (-7, 3)
focus: (-4, 3)
directrix: x = -10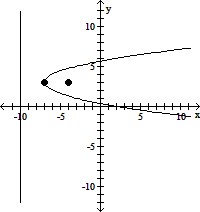
D. vertex: (3, -7)
focus: (3, -10)
directrix: y = -4