The graphs below illustrate the market for a product on which an excise tax has been imposed by government. Refer to the below graph. The excise tax on this product as shown in the graph is ultimately paid:
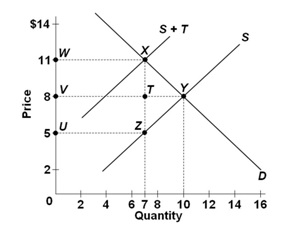
A. 100 percent by consumers
B. 100 percent by producers
C. 75 percent by consumers and 25 percent by producers
D. 50 percent by consumers and 50 percent by producers
D. 50 percent by consumers and 50 percent by producers
You might also like to view...
When Joe's disposable income is $50,000, his consumption expenditure is $45,000, and when his disposable income is $60,000, his consumption expenditure is $53,000. Joe's marginal propensity to consume is
A) 100. B) 1.25 C) 80. D) 0.80. E) $8,000.
Following Keynesian economics, and assuming a marginal propensity to consume (MPC) of 0.75, an increase in federal government spending of $100 billion at below full employment would be expected to shift the aggregate demand curve by $300 billion to the right
a. True b. False Indicate whether the statement is true or false
Identify the correct statement
a. As domestic income rises, imports rise and net exports fall. b. As foreign income rises, net exports fall. c. As domestic income falls, imports rise and net exports fall. d. As domestic income rises, imports fall and net exports rise. e. As foreign income falls, net exports rise.
The chairman of the Board of Governors of the Federal Reserve System is appointed by the Senate and approved by the President
a. True b. False