Consider a two-country, two-commodity model. The table below shows the units of Good X and Good Y produced in Country A and Country B per labor hour. The number of labor hours required to produce one unit of Good Y in Country B is ProductivityCountry ACountry BGood X1.000.50Good Y0.200.70
A. 0.5.
B. 1.43.
C. 1.
D. 2.
Answer: B
You might also like to view...
The short-run Phillips curve is
A) U-shaped. B) vertical at the natural unemployment rate. C) upward sloping. D) downward sloping. E) horizontal at the expected inflation rate.
Because of their higher value of marginal product
A) the demand curve for high-skilled workers lies to the right of the demand curve for low-skilled workers. B) the demand curve for high-skilled workers lies to the left of the demand curve for low-skilled workers. C) the supply curve for high-skilled workers lies to the right of the supply curve for low-skilled workers. D) the demand curve for high-skilled workers lies to the left of the supply curve for low-skilled workers.
In Figure 13-3 above, suppose that the Fed maintains a fixed real money supply and that commodity demand is also fixed. The range of shifts in the LM curve, LM1 to LM2 can then only be explained by
A) changes in the velocity of money. B) changes in the price level. C) changes in the demand for money. D) A and C.
Assuming the economy is represented by the graph shown, if the government were to enact a partially successful expansionary fiscal policy, it would be most likely to:
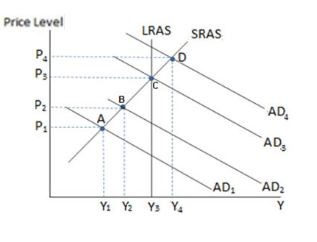
A. move from equilibrium A to B.
B. move from equilibrium B to A.
C. cause unemployment to temporarily increase.
D. cause deflation.