The graph shows the total sales in thousand of dollars from the distribution of x thousand catalogs. Find the average rate of change of sales with respect to the number of catalogs distributed for the change in x.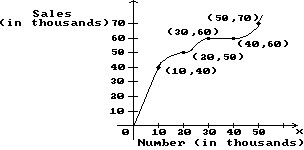 20 to 40
A. 
B. 4
C. 
D. 2
Answer: A
Mathematics
You might also like to view...
Provide an appropriate response.Find the domain of the function: f(x) = 
Fill in the blank(s) with the appropriate word(s).
Mathematics
Complete.11,250 lb =  T
T
A. 7
B. 4
C. 5
D. 11
Mathematics
Provide the requested proof.In the trapezoid below,  and
and  . If M is the midpoint of
  , prove that
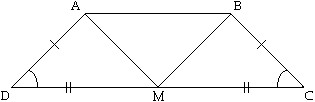
What will be an ideal response?
Mathematics
The 2× 2 Leslie matrix for a population of birds has eigenvalues r = 1.2 and r = 0.8 . Find the long-term growth rate for the population.
What will be an ideal response?
Mathematics