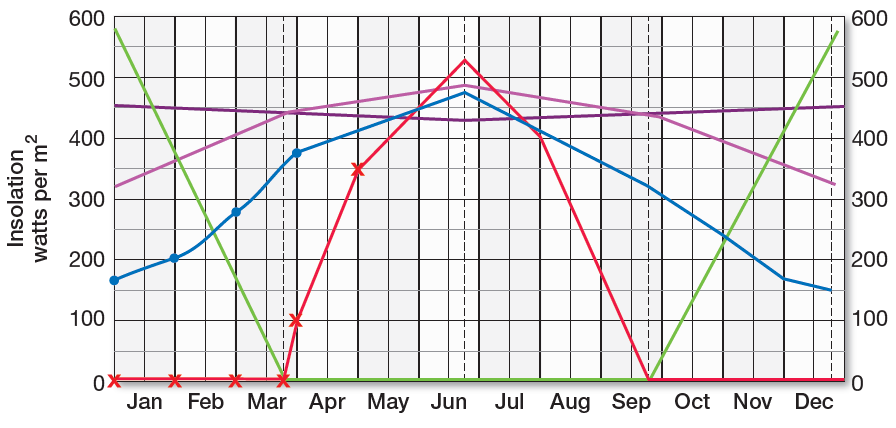
Using the data in Figure 6.1 and the graph provided below, plot data for specific latitudes for the first of each month. The graph you create will enable you to note the changes throughout the year in the amount of insolation received at a given latitude. Compare the differences in annual insolation patterns at various latitudes. Plot all seven latitudes on one graph, using color pencils to distinguish each. (Be sure to include a legend.)
• North Pole (started on the graph with a blue line and xs)
• New York (started on the graph; with a red line and dots)
• Tropic of Cancer
• Equator
• South Pole

You might also like to view...
If the mass of a cart is quickly loaded so that its mass doubles while being propelled by a constant force, the cart's acceleration
A. halves. B. doubles. C. stays the same. D. quadruples.
The fundamental difference between a motor and a generator is
A. a motor operates on force and a generator generates force. B. that input and outputs are reversed. C. both of these D. neither of these
Hygroscopic water and gravitational water are available for plant use
Indicate whether the statement is true or false
The apparent shift in the position of a nearby star when viewed from extreme points in Earth's orbit six months apart is called ________
Fill in the blank(s) with correct word