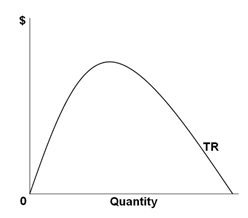
Refer to the graph below. When total revenue falls as output expands, marginal revenue is:
The following graph shows a total revenue curve for a monopolist.
A. Positive
B. Negative
C. Zero
D. Greater than demand at that output level
B. Negative
You might also like to view...
If the seller of a good gets less than his/her opportunity cost and the buyer pays more than his/her valuation of the good, economic value is created
Indicate whether the statement is true or false
Cost-benefit analysts often encounter the problem that those who would benefit from government provision of a public good tend to
a. overstate the benefit they would receive from the public good and those who would be harmed by government provision of a public good tend to overstate the costs they would incur from the public good. b. overstate the benefit they would receive from the public good and those who would be harmed by government provision of a public good tend to understate the costs they would incur from the public good. c. understate the benefit they would receive from the public good and those who would be harmed by government provision of a public good tend to overstate the costs they would incur from the public good. d. understate the benefit they would receive from the public good and those who would be harmed by government provision of a public good tend to understate the costs they would incur from the public good.
In 2010, a British Petroleum oil rig exploded in the Gulf of Mexico. The explosion resulted in a major oil spill and a decrease in the supply of oil. At the same time, the average price of gasoline decreased. Which of the following best explains the
decrease in the price of gasoline? A) The quantity demanded of gasoline increased. B) The demand for gasoline decreased, and the effect of the decrease in demand on the gasoline price was greater than the price effect of the decrease in supply. C) The demand for gasoline increased, and the effect of the increase in demand on the gasoline price was less than the price effect of the decrease in supply. D) The demand for gasoline remained unchanged.
Refer to the graph shown. If the price of this product fell from $10 to $8, producer surplus would fall from: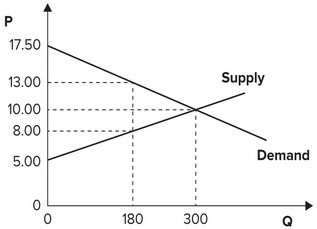
A. 250 to 180. B. 1,000 to 540. C. 750 to 270. D. 750 to 540.