Graph the polynomial function. f(x) = 6x - x3 - x5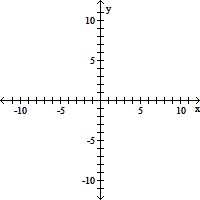
A. 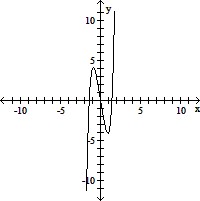
B. 
C. 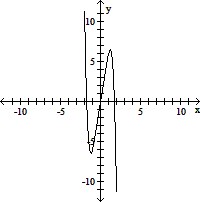
D. 
Answer: D
You might also like to view...
Use the graph to evaluate the limit. f(x)
f(x)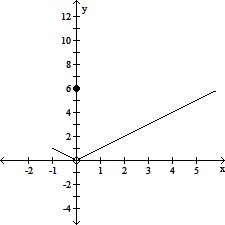
A. does not exist B. 0 C. -1 D. 6
First, rewrite each equation in exponential form. Then, use a table of coordinates and the exponential form to graph the logarithmic function. Begin by selecting -2, -1, 0, 1 and 2 for y. Finally, based on your graph, describe the shape of a scatter plot that can be modeled by f(x) = log b x, 0 < b < 1.y = log1/9 x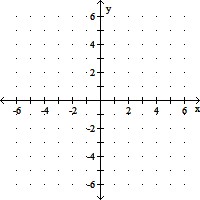
A. 
increasing
B. 
increasing,
although rate of increase is slowing down
C. 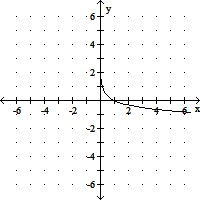
decreasing,
although rate of decrease is slowing down
D. 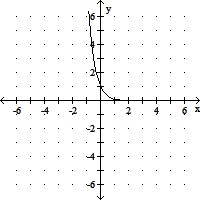
decreasing,
although rate of decrease is slowing down
Solve the equation.4x = 29(Round to the nearest hundredth.)
A. {0.41} B. {2.98} C. {2.43} D. {7.25}
Add or subtract. Write the answer in lowest terms. +
+ 
A. 
B. 
C. 
D. 