Solve the problem.The following graph shows the private, public and total national school enrollment for students for select years from 1970 through 2000.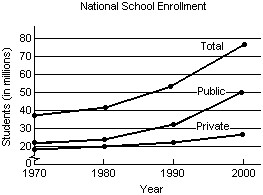 i) How is the graph for total school enrollment, T, determined from the graph of the private enrollment, r, and the public enrollment, u?ii) During which 10-year period did the total number of students enrolled increase the least?iii) During which 10-year period did the total number of students enrolled increase the most?
A.
| i) | T is the sum of r and u. |
iii) 1990-2000
B.
| i) | T is the sum of r and u. |
iii) 1980-1990
C.
| i) | T is the difference of r and u. |
iii) 1990-2000
D.
| i) | T is the sum of r and u. |
iii) 1970-1980
Answer: A
Mathematics
You might also like to view...
Simplify.(-7x - 8)2
A. -7x2 + 112x + 64 B. 49x2 + 64 C. -7x2 + 64 D. 49x2 + 112x + 64
Mathematics
Solve the equation. Express radicals in simplest form.(4z - 1)2 = 
A.  , -
, - 
B.  ,
, 
C.  , -
, - 
D. 4, -2
Mathematics
Factor using the formula for the sum or difference of two cubes.125x3 + 8
A. (5x - 2)(25x2 + 10x + 4) B. (5x + 2)(25x2 - 10x + 4) C. (5x + 2)(25x2 + 4) D. (5x + 2)(25x2 + 10x + 4)
Mathematics
Use the Factor Theorem to determine whether x - c is a factor of f(x).f(x) = 30x3 + 104x2 - 40x - 66; x - 
A. Yes B. No
Mathematics