Refer to the information provided in Figure 6.1 below to answer the question(s) that follow.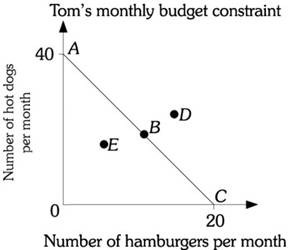 Figure 6.1Refer to Figure 6.1. The slope of budget constraint AC is
A. -5.0.
B. -2.0.
C. -0.5.
D. indeterminate from this information because prices are not given.
Answer: B
You might also like to view...
The table above shows the revenue figures for the top four firms along with a total for the remaining firms in the fast-food industry. What is the four-firm concentration ratio for the industry?
A) 200 B) 20 percent C) 25 percent D) 80 percent E) 100 percent
Refer to Scenario 2.1. If P = $25, which of the following is true?
A) There is a surplus equal to 30. B) There is a shortage equal to 30. C) There is a shortage, but it is impossible to determine how large. D) There is a surplus, but it is impossible to determine how large.
Refer to the accompanying figure.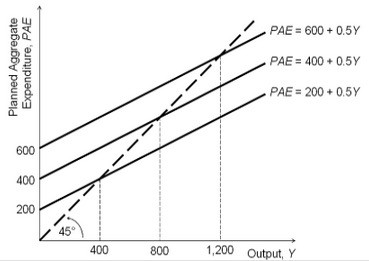 Based on the figure, if autonomous spending falls from 400 to 200, then the new short-run equilibrium output will equal:
A. 800. B. 1,200. C. 400. D. 600.
A Phillips curve implies
A. a negative relationship between consumption and saving. B. a positive relationship between inflation and prices. C. a negative relationship between inflation and unemployment. D. a positive relationship between consumption expenditure and inflation.