Write a fraction to represent the shaded area of the figure.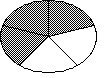
A. 
B. 
C. 
D. 
Answer: D
You might also like to view...
A new chocolate company is estimating how many candy bars per week college students will consume of their line of products. The graph shows the probable number of candy bars students (age 18-22) will consume from year 0 to year 10. B(x) gives the number of candy bars for boys, G(x) gives the number of candy bars for girls, and T(x) gives the total number for both groups. Use the graph to answer the question.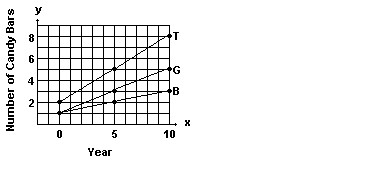 Use the slopes of the line segments to decide in which period (0-5 or 5-10) the number of candy bars per week increased more rapidly.
A. 0-5 B. 5-10 C. The number of candy bars increased at the same rate in both periods
Simplify the expression.-(-22)
A. -22 B. 0 C. -1 D. 22
Solve the problem.Write four out of five students as a decimal and as a percent.
A. 8, 800% B. 0.8, 8% C. 0.8, 800% D. 0.8, 80%
Solve the problem. Round to the nearest cent.Nelson Heating paid no dividends for 2 years. After 3 years, a dividend of $1,500,000 was declared. Find the dividend per share if the company had 10,000 cumulative preferred shares outstanding of $130 par value at 11% and 277,000 common shares.
A. Preferred: $49.50 Common: $3.63 B. Preferred: $28.60 Common: $4.38 C. Preferred: $42.90 Common: $3.87 D. Preferred: $14.30 Common: $4.90