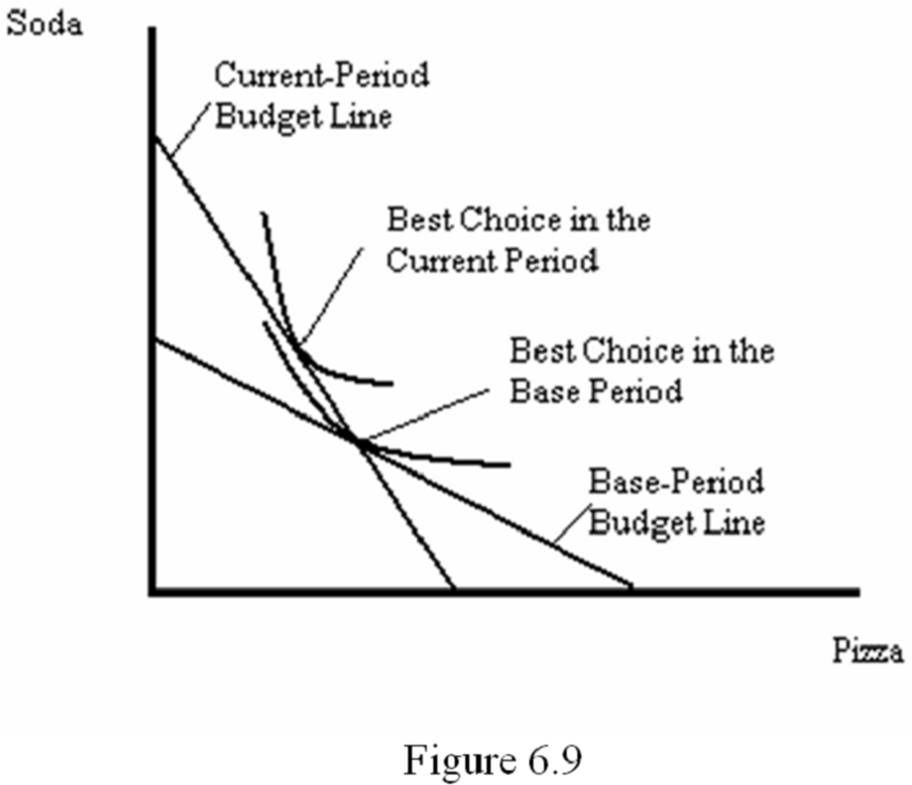
Suppose an individual consumes just pizza and soda. Using a graph, explain how the substitution bias causes the Lespeyres price index to overstate the true change in the cost of living resulting from an increase in the price of pizza.
What will be an ideal response?
See Figure 6.9. The consumer originally consumes at the point labeled "Best Choice in the Current Period". An increase in the price of pizza will cause the budget line to rotate to a new position labeled "Current-Period Budget Line". If we assume real income remains constant, then the consumer can still afford the original combination of pizza and soda. That implies that the current-period budget line passes through the best choice combination in the base period. However, the consumer can move to a higher indifference curve by choosing the combination labeled "Best Choice in Current Period". The consumer achieves this higher level of utility by substituting soda in place of the relatively more expensive pizza.
You might also like to view...
Used car buyers believe a car is good quality when the seller signals the car's quality by offering a warranty because
A) car sellers would never lie. B) car buyers are gullible. C) the signal cannot be false. D) a false signal can be costly to the seller.
Low standards reduce production costs and change a nation's comparative advantage
Indicate whether the statement is true or false
According to the figure shown, if Adidas charges a low price, then Nike should:
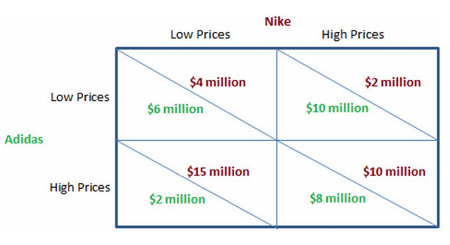
A. charge a high price.
B. leave the market.
C. charge a low price.
D. give an ultimatum.
If we compare income mobility in relative terms, we would measure whether a person's income:
A. is higher than her parents' income. B. places her higher up in the income distribution than her parents' income. C. is higher at the end of her career compared to the beginning. D. rises with age for all people.