The pie chart below shows the number of pizzas consumed by college students in a typical month. Use the chart to answer the question. 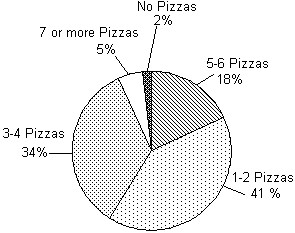 What percent of college students consume 3 or more pizzas in a typical month?
A. 98%
B. 52%
C. 57%
D. 34%
Answer: C
Mathematics
You might also like to view...
A basketball is tossed onto the hardwood, where it bounces several times. We measure its location as distance down from the ceiling. When the ball is moving upward, what can be said about its velocity?
A. Velocity is positive. B. Velocity is negative. C. Velocity is 0. D. None of the above.
Mathematics
Locate the fraction on the number line.2 ![]()
A. ![]()
B. ![]()
C. ![]()
D. ![]()
Mathematics
Find the angles of the trignometric values in degrees. ? represents the unknown angle measure. cos ? = 0.3152
A. 71.6° B. 69.2° C. 69.19° D. 71.63°
Mathematics
Write an equation to describe the variation. Use k for the constant of proportionality.s varies directly as r
A. r = ks
B. s = 
C. s = kr
D. r = 
Mathematics