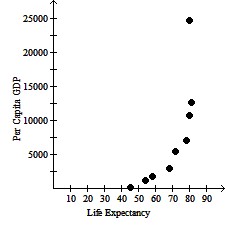
Make a scatter diagram for the data.The table shows the life expectancy at birth for females and per capita GDP for nine countries. (Data for 1995) 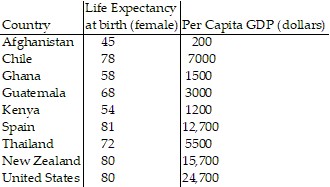 Plot per capita GDP on the horizontal axis and life expectancy on the vertical axis.
A. 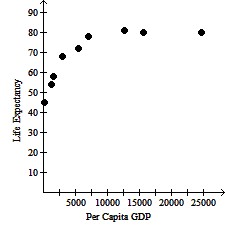
B.
Per Capita GDP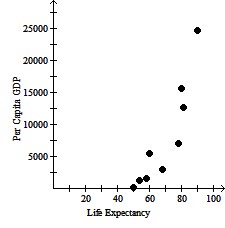
| ? | Life Expectancy |
C.
D.

| ? |
Answer: A
Mathematics
You might also like to view...
Use logax = (ln x)/(ln a) to calculate the logarithm. Round to the nearest ten thousandth.log2 78.05
A. 0.1591 B. 6.2863 C. 39.0250 D. 1.8924
Mathematics
Simplify the expression. +
+ 
A. 
B. 
C. 
D. 
Mathematics
Determine whether the given solution is correct. If it is not, find the solution.Is  the solution for -6x - 4 = 8 - 9x?
A. Yes
B. No; x = 4
C. No; x = - 
D. No; x = - 
Mathematics
Solve the problem.Anne purchased a bond for a museum valued at $8000 for $2400. If the bond pays 5.5% annual interest compounded monthly, how long must she hold it until it reaches its full face value?
A. 21.94 years B. 19.94 years C. 23.94 years D. 20.94 years
Mathematics