Solve the problem.An accountant tabulated a firm's profits for four recent years in the following table: The accountant then fit both a linear graph and an exponential curve (seen below) to the data, in order to estimate future profits. Use the exponential graph to estimate the profits in the year 2001.
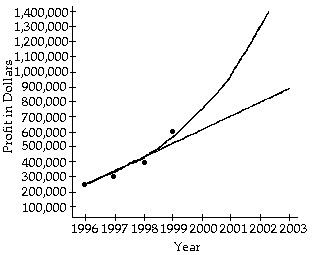
A. About $1,300,000
B. About $300,000
C. About $1,000,000
D. About $750,000
Answer: C
You might also like to view...
Find G'(x).G(x) = 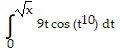
A. 10 cos (x5)
B. 9 cos (x5) - 9 sin (x5)
C.  cos (x5)
D. 9 cos (x5)
Factor the polynomial f(x). Then solve the equation f(x) = 0.f(x) = x3 - 10x2 + 27x - 18
A. (x - 1)(x - 3)(x - 7) ; 1, 3, 7 B. (x - 1)(x - 3)(x - 6) ; 1, 3, 6 C. (x - 1)(x + 3)(x - 6) ; -1, 3, -6 D. (x + 1)(x - 3)(x + 6) ; -1, 3, -6
Find the coordinates of the vertex and the intercepts of the quadratic function. When necessary, approximate the x-intercepts to the nearest tenth.s(x) = -x2 - 22x - 105
A. V(11, 16); I(0, -105); no x-intercepts B. V(-11, 16); I(0, -105); (-7, 0); (-15, 0) C. V(22, -105); I(0, 105); (15, 0); (7, 0) D. V(-22, -105); I(0, -105); (-22, 0); (22, 0)
Subtract.13 - (-4)
A. -17 B. 9 C. -9 D. 17