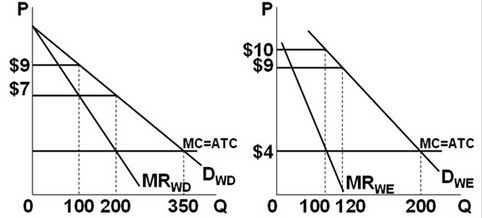
 Refer to the figures above. Suppose the graphs represent the demand for use of a local golf course for which there is no significant competition (it has a local monopoly). P denotes the price of a round of golf and Q is the quantity of rounds sold each day. If the left graph represents the demand during weekdays and the right graph the weekend demand, how much economic profit will this profit-maximizing golf course earn over the course of a full seven-day week?
A. $3400
B. $4200
C. $2700
D. $3700
Answer: B
Economics
You might also like to view...
If a curve falls and then rises, it
A) has a maximum. B) has a minimum. C) has a linear relationshi
Economics
As the investment demand curve becomes steeper, the crowding-out effect will become smaller
a. True b. False Indicate whether the statement is true or false
Economics
Brazil has shown ________ interest in becoming a leader of the global South
a. More b. Less
Economics
If a monopolist knows its price elasticity of demand is greater than one, then a(n) _____ in price will _____ total revenue.
a. decrease; increase b. increase; not change c. increase; increase d. decrease; decrease
Economics