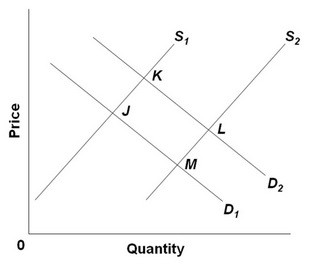
 Refer to the above diagram, in which S1 and D1 represent the original supply and demand curves and S2 and D2 the new curves. In this market the indicated shift in demand may have been caused by:
A. an increase in incomes if the product is a normal good.
B. an increase in incomes if the product is an inferior good.
C. a decline in the number of buyers in the market.
D. a decline in the price of a substitute good.
Answer: A
You might also like to view...
When a natural monopoly is regulated using a marginal cost pricing rule, what can you say about the firm's profit and the market's efficiency?
What will be an ideal response?
The above figure shows supply and demand curves for milk. If the government passes a $2 per gallon specific tax, the loss in consumer surplus will equal
A) b + c + f + g. B) f + g. C) b + f. D) c + g.
Interest payments on the national debt are about _____ percent of total federal expenditures a year.
A. 2 B. 5 C. 7 D. 11
The decision to smoke cigarettes is not subject to present bias because the health risks of smoking cigarettes are widely known.
Answer the following statement true (T) or false (F)