Solve the problem.The following data represents the average percent of possible sunshine for a certain city in Indiana. 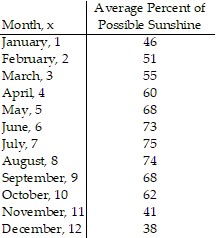 Draw a scatter diagram of the data for one period. Find the sinusoidal function of the form
  that fits the data. Draw the sinusoidal function on the scatter diagram. Use a graphing utility to find the sinusoidal function of best fit. Draw the sinusoidal function of best fit on the scatter diagram.
What will be an ideal response?
y = 15.99 sin (0.57x - 2.29) + 60.62
Mathematics
You might also like to view...
Perform the indicated operation. Simplify the result, if possible. -
- 
A. x + 10
B. x - 6
C. 
D. 
Mathematics
d. The power output is 50% of max. at fCO and the output decreases as frequency increases

a. VR decreases, VC increases.
b. VR remains the same, VC decreases.
c. VR increases, VC remains the same.
d. VR increases, VC decreases.
e. VR increases, VC increases.
Mathematics
Solve the problems.The 4th hole at the Riverwoods Golf Course is 300 yards long. How long would it be on a model with a scale of 1.5 inches to 100 yards? Round to nearest tenth.
A. 45.0 inches B. 150.0 inches C. 4.5 inches D. 2.3 inches
Mathematics
Graph the function.y = csc x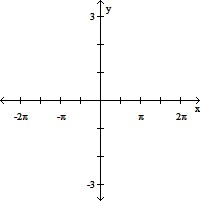
A. 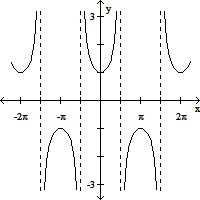
B. 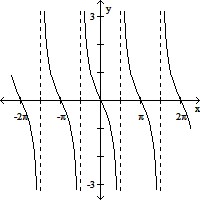
C. 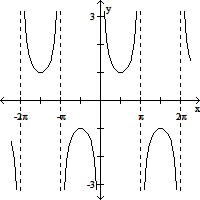
D. 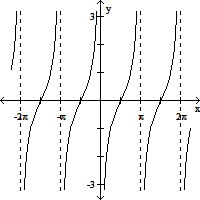
Mathematics