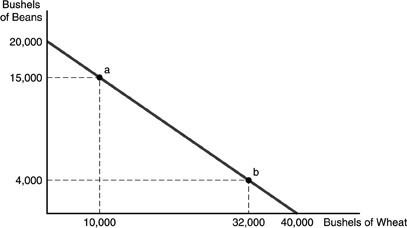
 Refer to the above figure. If the farmer is growing 8,000 bushels of beans and 8,000 bushels of wheat, then we know that
A. the farmer cannot be using the amount of land that was used to construct the curve.
B. the farmer is not using resources efficiently.
C. the farmer is using more land for wheat than for beans.
D. the farmer should increase the amount of wheat grown and reduce the amount of beans.
Answer: B
You might also like to view...
The demand curve in the figure above illustrates the demand for a product with
A) zero price elasticity of demand at all prices. B) infinite price elasticity of demand. C) unit price elasticity of demand at all prices. D) a price elasticity of demand that is different at all prices.
The smaller the fraction of an investment financed by borrowing
A) the greater the potential return and the smaller the potential loss on that investment. B) the greater the potential return and potential loss on that investment. C) the smaller the potential return and potential loss on that investment. D) the smaller the potential return and the greater the potential loss on that investment.
The marginal cost curve of a firm measures
A) external costs. B) pollution costs. C) private costs. D) social costs.
Most spells of unemployment are short, and most unemployment observed at any given time is long-term
a. True b. False Indicate whether the statement is true or false