This graph demonstrates the domestic demand and supply for a good, as well as a tariff and the world price for that good. According to the graph shown, the change in producer surplus brought about by the introduction of a tariff is:
A. an increase of HIJKL.
B. a loss of HIJKL.
C. an increase of H.
D. a loss of H.
Answer: C
You might also like to view...
Refer to Figure 4-3. What is the total amount that Kendra is willing to pay for 3 ice cream cones?
A) $2.50 B) $7.50 C) $9.00 D) $13.50
A monopolist's profit maximizing price is $15 . At MC=MR, the output is 100 units and the MC is $10 . At this level of production, average total costs are $12 . Monopolist's profits are
a. $300 b. $1500 c. $500 d. None of the above
Refer to Figure 8.2. Which graph illustrates an output expansion path with a constant capital-labor ratio?
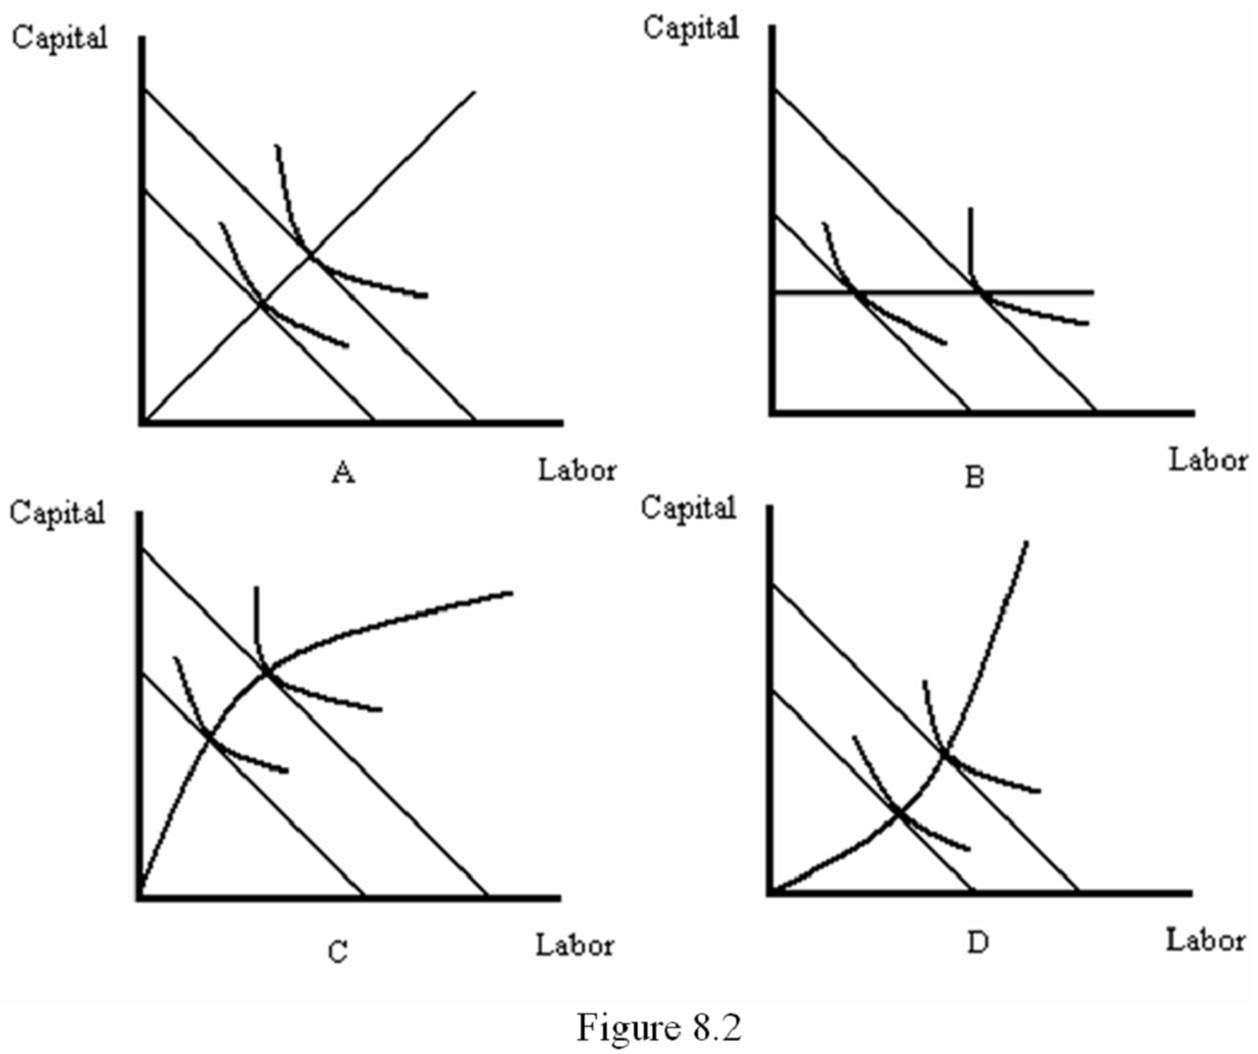
A. A
B. B
C. C
D. D
If an increase in quantity demanded of a product reduces the quantity demanded of another, then the two goods are said to be substitutes
a. True b. False Indicate whether the statement is true or false