You have been asked by your economics professor to graph the market for lumber and then to analyze the change that would occur in equilibrium price as a result of recent forest fires in the west. Your first step would be to
a. decide which direction to shift the curve.
b. decide whether the fires affected demand or supply.
c. graph the shift to see the effect on equilibrium.
d. None of the above is correct.
b
You might also like to view...
Use the following graph to answer the next question.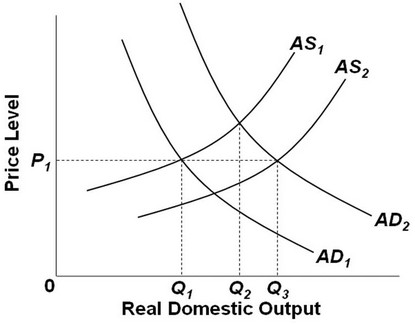 In the figure, AD1 and AS1 represent the original aggregate supply and demand curves. If Q1 is full-employment output, then the long-run aggregate supply curve is located at output level ________.
A. Q2 B. Q1 C. Q3 D. None of these choices are correct.
Refer to Figure 14.2. Hurricane Katrina was responsible for destroying a large portion of oil and natural gas refining capacity on the Gulf coast in 2005. Other things equal, this would best be represented by a movement from
A) point A to point B. B) point B to point A. C) point B to point C. D) point A to point C.
What do American drivers on congested roads and Soviet shoppers waiting in line to purchase clothing have in common?
a. Both the American drivers and the Soviet shoppers are consuming products at prices that do not represent the full costs of the products. b. Both the American drivers and the Soviet shoppers can purchase as much as they want at the market price. c. Both the American drivers and the Soviet shoppers could avoid waiting if the prices were lowered. d. American drivers and Soviet shoppers have nothing in common.
A Giffen good is a good for which
a. a decrease in the price decreases the quantity demanded. b. the income effect outweighs the substitution effect. c. an increase in the price decreases the quantity demanded. d. Both a) and b) are correct.