The table shows, for some particular year, a listing of several income levels and, for each level, the proportion of the population in the level and the probability that a person in that level bought a new car during the year. Given that one of the people who bought a new car during that year is randomly selected, find the probability that that person was in the indicated income category. Round your answer to the nearest hundredth.  $15,000 - $19,999
A. 0.04
B. 0.05
C. 0.08
D. 0.07
Answer: B
You might also like to view...
Next year's value of a certain quantity is 107% of last year's value. ? Which of the following can you conclude? ?
A. The quantity grows exponentially. B. The quantity grows linearly. C. The quantity decays exponentially. D. The quantity decays linearly.
Provide an appropriate response.There are 13 people on a committee, and 10 of them are women. What is the ratio of the number of women to the total number of people on the committee?
A. 
B. 
C. 
D. 
Determine whether the data represent direct variation, inverse variation, or neither.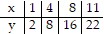
A. Direct B. Neither C. Inverse
Use a power series to solve the differential equation  .
?
.
?
A.  , where
  and
and  are arbitrary constants
B.  , where and are arbitrary constants
C.  , where and are arbitrary constants
D.  , where and are arbitrary constants
E.  , where and are arbitrary constants