Exhibit 2-11 Production possibilities curves
In Exhibit 2-11, which of the following could have caused the production possibilities curve to shift from the one labeled B to the one labeled A?
A. A major natural disaster.
B. An increase in resources.
C. An advance in technology.
D. A decrease in unemployment.
Answer: A
You might also like to view...
Refer to the figure below. In response to gradually falling inflation, this economy will eventually move from its short-run equilibrium to its long-run equilibrium. Graphically, this would be seen as 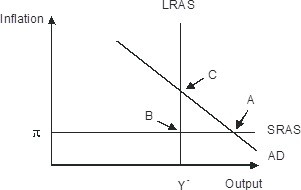
A. long-run aggregate supply shifting leftward B. Short-run aggregate supply shifting upward C. Short-run aggregate supply shifting downward D. Aggregate demand shifting leftward
In a decreasing-cost industry, the entry of new firms lowers average cost at each level of output
Indicate whether the statement is true or false
The LM curve
A) is horizontal. B) is vertical. C) slopes downward. D) slopes upward.
Refer to the information provided in Figure 24.3 below to answer the question(s) that follow.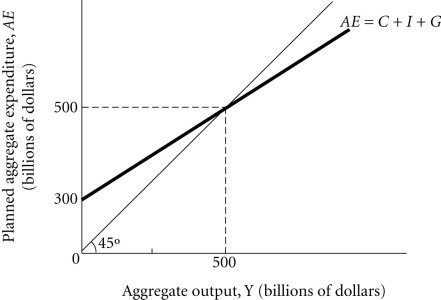 Figure 24.3Refer to Figure 24.3. The tax multiplier is
A. -4. B. -2.5. C. -2. D. -1.5.