A supply curve is a:
A. graph depicting various price-quantity combinations of multiple goods.
B. graph that visually displays the supply schedule.
C. graph that shows the quantities of a particular good or service that producers will sell at one price.
D. table that displays various price-quantity combinations of a good or service.
Answer: B
You might also like to view...
Consider a diagram in which the variable measured on the y-axis remains constant while the variable measured on the x-axis increases. The graph of these two variables is
A) a line that has positive slope. B) non-existent because the two variables are not related. C) a horizontal line. D) a vertical line. E) a line that has a negative slope.
In the attempt to use deficits to fight the Great Recession, what was the size of the federal government's "stimulus" plan of 2009?
A) $7.87 billion B) $78.7 billion C) $787 billion D) $7.87 trillion
_____ is an example of a black market activity
a. Purchasing weapons in an alley b. Purchasing cars from an authorized dealer c. Purchasing furniture from a shop d. Purchasing drugs from a pharmacy
Use the following graph to answer the next question.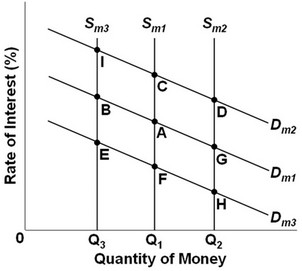 The graph shows the supply and demand for money where Dm1, Dm2, and Dm3 represent different demands for money and Sm1, Sm2, and Sm3 represent different levels of the money supply. The initial equilibrium point is A. What will be the new equilibrium point following an autonomous increase in the asset demand for money?
A. I B. D C. G D. C