Refer to Figure 2.2. Which diagram best represents the effect of lower fertilizer prices on the market for corn?
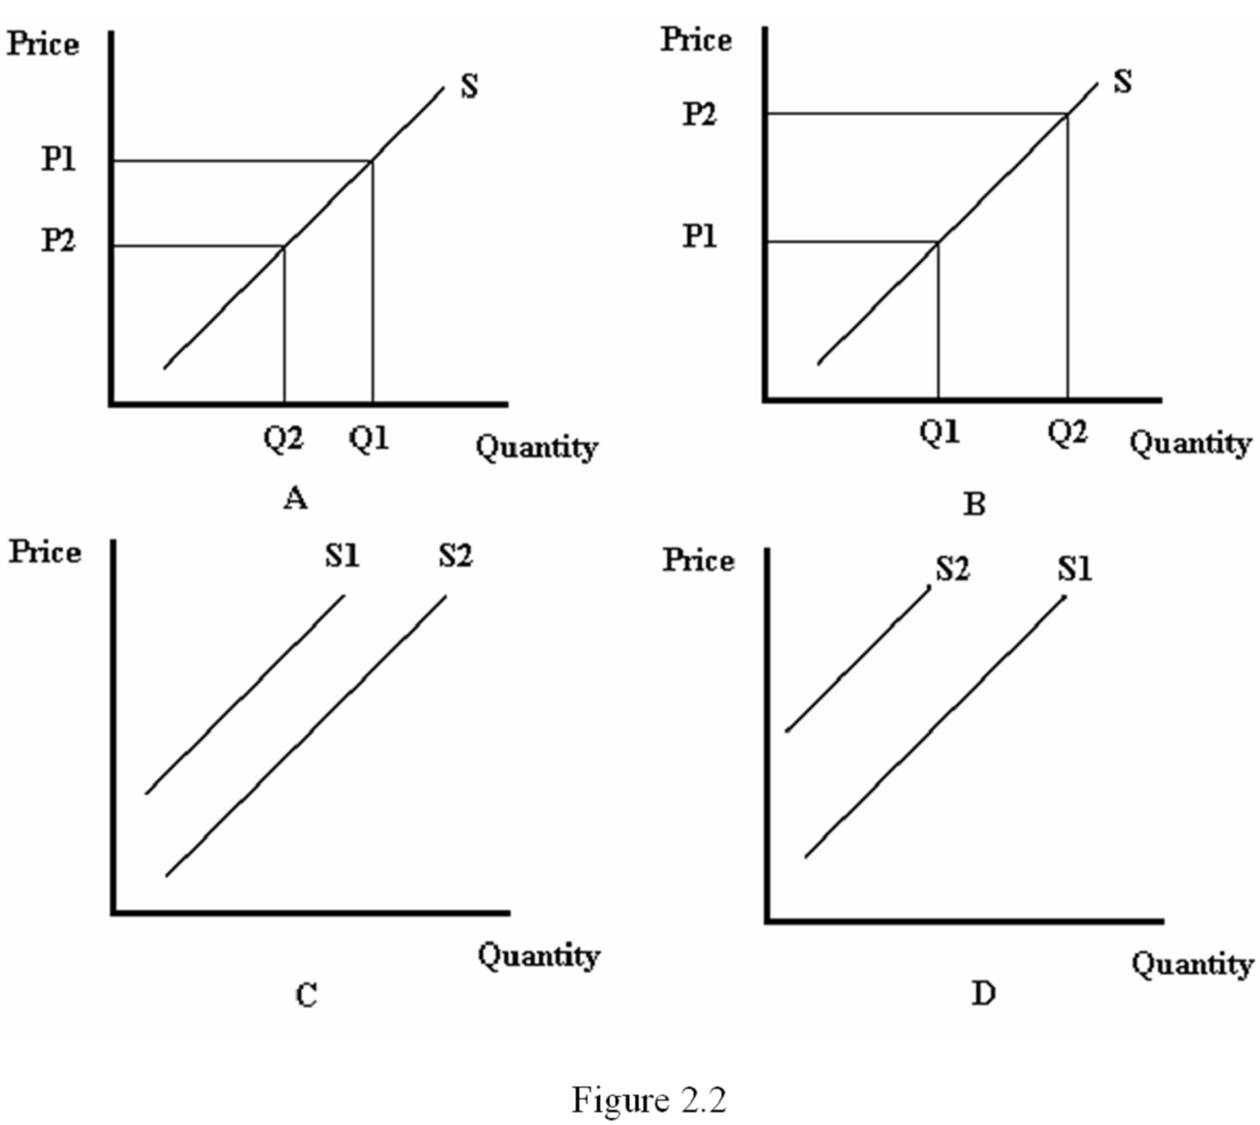
A. A
B. B
C. C
D. D
C. C
You might also like to view...
A rise in the price level produces ________ the potential GDP line
A) a movement downward along B) a leftward shift of C) a rightward shift of D) a movement upward along E) neither a shift of the potential GDP line nor a movement along
The figure above shows the market for milk. If the efficient quantity of milk is produced, the consumer surplus is
A) $100. B) $400. C) $200. D) $600.
When economists express the deficit, they generally do it as:
A. the total amount the government overspent. B. a percentage of the amount of taxes they collect. C. a percentage of total GDP. D. a partitioned amount based on where the government spent the money.
The amount of money ultimately created per dollar deposited when people hold no cash is found using the:
A. excess reserve ratio. B. required reserve ratio. C. money demand ratio. D. money multiplier.