Find the indicated probability.The table below shows the soft drink preferences of people in three age groups.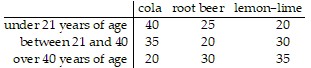 If one of the 255 subjects is randomly selected, find the probability that the person is over 40 and drinks cola.
A. 
B. 
C. 
D. None of the above is correct.
Answer: A
You might also like to view...
Simplify the expression.
A. 
B. 
C. 
D. 
Determine if the series converges or diverges; if the series converges, find its sum.
A. Converges; 
B. Converges; 
C. Converges; 
D. Diverges
Write the expression as a single logarithm. Leave your answer in simplest form without negative or fractional exponents.5 loga q -  loga r +
  loga f - 3 loga p
A. loga 
B. loga 
C. loga
D. loga 
Solve the problem.The paired data below consist of the test scores of 6 randomly selected students and the number of hours they studied for the test. By using linear regression, the following function is obtained:  where x is number of hours studied and y is score on the test. Use this function to predict the score on the test of a student who studies 11 hours. Round to the nearest tenth.
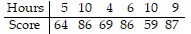
A. 83.8 B. 84.1 C. 74.1 D. 79.1