Use the figure below to answer the following question.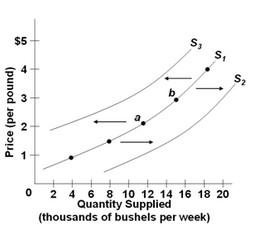 The figure shows three supply curves for apples. If you observe the supply of apples shift from S1 to S3, which of the following could be responsible for this shift?
A. Apple production has increased.
B. The producers of apples now receive a subsidy.
C. The producers of apples now must pay a tax.
D. Apple producers are willing to sell more at every price.
Answer: C
You might also like to view...
Which among the following will happen if the Fed buys bonds from a private bank?
A) The private bank's total assets will decrease. B) The Fed's total assets will decrease. C) The private bank's total assets will increase. D) The Fed's total liabilities will increase.
Some economists believe that one factor that caused the financial crisis of 2007-2009 was top managers of large financial services firms making riskier investments than were in the best interests of the firms' shareholders
Indicate whether the statement is true or false
Risk is typically measured:
a. by comparing the size of a firm to other firms operating in the market. b. by looking at the economic profit that a firm has earned in the past few years. c. by determining whether the bonds issued by a firm are of high or low value. d. by comparing how much the stock price fluctuates compared with an average firm. e. by comparing how much the price of the bond falls whenever the price of a firm's product rises.
The goal of utility maximization is to allocate your ________ in order to maximize your ________.
A. utility; spending B. resources; satisfaction C. resources; desires D. time; work