In the graph below at a price of P*, the profit maximizing level of output is 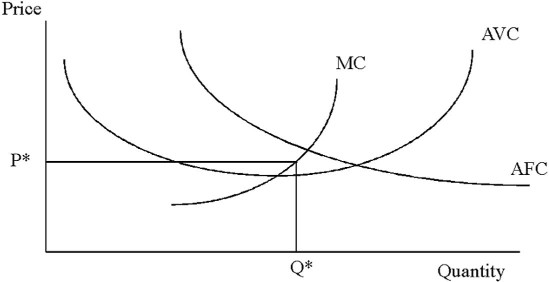
A. Q*.
B. zero.
C. below Q* but above zero.
D. above Q*.
Answer: A
You might also like to view...
The average person spends _________ of waking hours in some form of communication
a. 10 b. 20 c. 70 d. 90
When the economy is creating less output than its potential, it means:
A. there are some resources that are unemployed. B. the economy is in an economic boom. C. contractionary policy needs to be enacted. D. governments are likely to reduce their spending.
The price of a bond and the interest rate
A) are positively related. B) are inversely related C) are directly related. D) are linked by the capital asset pricing model.
A price-setting firm faces the following estimated demand and average variable cost functions:Qd = 800,000 - 2,000P + 0.7M + 4,000PRAVC = 500 - 0.03Q + 0.000001Q2where Qd is the quantity demanded, P is price, M is income, and PR is the price of a related good. The firm expects income to be $40,000 and PR to be $53. Total fixed cost is $2,600,000. What is the profit-maximizing choice of output?
A. 20,000 units B. 12,000 units C. 10,000 units D. 8,000 units E. 0 units, the firm shuts down