Plot the graph and find the value from the graph.The town of Appleville recorded the following dates and populations.YEAR POPULATION (in thousands)1980 49.51985 511990 541995 60 Draw a graph of the population as a function of time. What is the approximate population of Appleville in 1987?
A. 52,000
B. 53,000
C. 54,000
D. 51,000
Answer: A
Mathematics
You might also like to view...
Graph.y = x2 - 3
A. 
B. 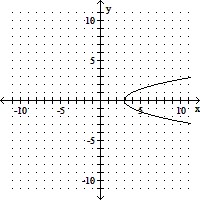
C. 
D. 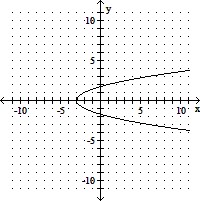
Mathematics
For the given function, find the rate of change.y = 700 - 6x
A. 5 B. 700 C. -6 D. 6
Mathematics
Use an associative property to complete the statement. Do not simplify.0.03(60y) = 
A. (0.03 ? 60)y B. 60(0.03y) C. 0.03y(60) D. (0.03 + 60)y
Mathematics
Rewrite the statement so the inequality symbol points in the opposite direction.36 > 4
A. 36 ? 4 B. 36 < 4 C. 4 > 36 D. 4 < 36
Mathematics