Use the REGRESSION feature on a graphing calculator.The paired data below consists of the temperature on randomly chosen days and the amount of a certain kind of plant grew (in millimeters).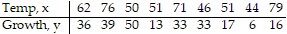 Find the linear function that predicts a plant's growth as a function of the temperature. Round your answer to two decimal places.
A. y = - 0.06 x2 + 7.20x - 191.23
B. y = - 9.19x3 + 0.11x2 - 2.90x + 6.54
C. y = 14..57x + 0.21
D. y = 0.21x + 14.57
Answer: D
You might also like to view...
Calculate the circulation of the field F around the closed curve C.F = x2y3i + x2y3j; curve C is the counterclockwise path around the rectangle with vertices at 

 , and
, and 
A. 9 B. 153 C. 0 D. 108
Solve the equation by the zero-factor property.x(2x + 10) = 0
A. 
B. 
C. {0, 5}
D. {0, -5}
Identify whether the given scatterplot shows a positive association, negative association, or no association.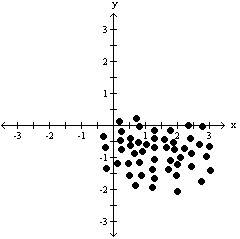
A. positive association B. no association C. negative association
Use the FOIL method to multiply the binomials. Assume any variable exponents represent whole numbers.(9x - y)(7x - 12y)
A. 16x2 - 115xy + 12y2 B. 63x2 - 115xy - 12y2 C. 63x2 - 115xy + 12y2 D. 63x2 + 115xy + 12y2