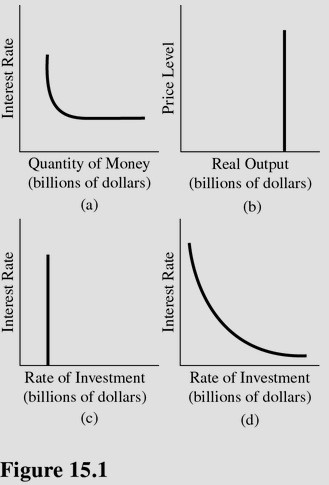
 Which diagram in Figure 15.1 best represents a situation in which lower interest rates do not stimulate additional investment?
A. d.
B. b.
C. c.
D. b and d.
Answer: C
You might also like to view...
Corporate bonds differ from corporate stock in that
a. only bondholders vote on the board of directors b. only bondholders can sit on the board of directors c. bonds carry a stated rate of interest d. bonds are issued as common and preferred e. bondholders are considered the owners of the business
If an investor had a $25,000 long-term capital gain on a $100,000 investment from 1984 to 2010, her real rate of return was most likely
a. equal to the expected rate of inflation. b. equal to the nominal rate of inflation. c. zero. d. negative.
Between 1910 and today, the number of farmers in the United States _____________ dramatically as a result of ___________________ in farming in the twentieth century
A) dropped; technological improvements B) rose; technological improvements C) dropped; technological declines D) rose; technological declines
The value of money falls. This might be because the Federal Reserve
a. bought bonds, which increased the money supply. b. bought bonds, which decreased the money supply. c. sold bonds, which increased the money supply. d. sold bonds, which decreased the money supply.