The above figure shows the market for neckties after the government has imposed a tax. How much government revenue is generated by the tax?
A) $1,000.00 per month
B) $800.00 per month
C) $500.00 per month
D) $400.00 per month
D
You might also like to view...
The figure above shows the labor market in a region. If a minimum wage of $8 an hour is imposed, then there are ________ unemployed workers
A) 20,000 B) 40,000 C) 60,000 D) 80,000 E) zero
Of the $840 billion American Recovery and Reinvestment Act stimulus package which was enacted in 2009, approximately one-third took the form of ________ and two-thirds took the form of increases in ________
A) treasury bond purchases; the money supply B) tax rebates; tax cuts C) tax cuts; government expenditures D) discretionary government spending; transfer payments
An increase in the actual inflation rate is represented by a
A) movement up and along a given Phillips curve. B) movement down and along a given Phillips curve. C) leftward shift in the Phillips curve. D) rightward shift in the Phillips curve.
Using Figure 1 above, if the aggregate demand curve shifts from AD2 to AD3 the result in the long run would be: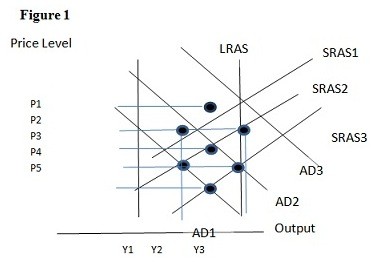
A. P2 and Y2. B. P1 and Y2. C. P4 and Y2. D. P1 and Y1.