Use a graphing calculator to plot the data and find the quadratic function of best fit.An engineer collects data showing the speed s of a given car model and its average miles per gallon M. Use a graphing calculator to plot the scatter diagram. What is the quadratic function of best fit?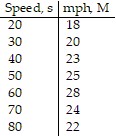
A. M(s) = -0.0063x2 + 0.720x + 5.142
B. M(s) = 0.063x2 + 0.720x + 5.142
C. M(s) = -0.631x2 + 0.720x + 5.142
D. M(s) = -6.309x2 + 0.720x + 5.142
Answer: A
Mathematics
You might also like to view...
Round following numbers as indicated.2.59588 (nearest thousandth)
A. 2.596 B. 2.59588 C. 2.696 D. 2.496
Mathematics
Translate the description to symbolic form.The surface area for a sphere is four times the product of ? and the square of the radius.
A. 16?r2 B. 4?2r2 C. 4?r2 D. 4?r
Mathematics
Graph. -
-  = 1
= 1
A. 
B. 
C. 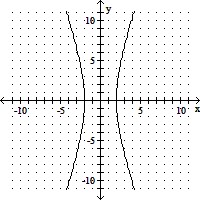
D. 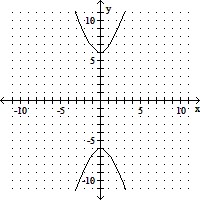
Mathematics
Perform the indicated operation.42 cm - 37 mm (in centimeters)
A. 38.3 cm B. 41.63 cm C. 383 cm D. 5 cm
Mathematics