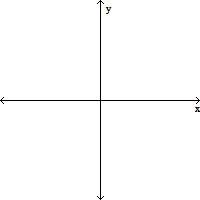
Use the accompanying graph of y = f(x) to sketch the graph of the indicated function.y = -f(x)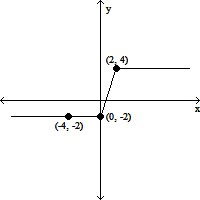
A. 
B. 
C. 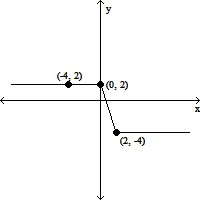
D. 
Answer: C
Mathematics
You might also like to view...
Find the volume of the solid generated by revolving the region bounded by the given lines and curves about the  . y = 2csc x, y = 2
 ,
,  ? x ?
? x ? 
A. 4?2 + 8? B. ?2 + 4? C. 4?2 - 8? D. 2?2 - 4?
Mathematics
Solve for x and graph the solution.0.6x + 1.1 > 0.9x - 0.1![]()
A. x < -4![]()
B. x > 4![]()
C. x > -4![]()
D. x < 4![]()
Mathematics
Solve the problem.The logistic function  represents the population of a species introduced into a new territory after t years. What will the population be in 20 years?
A. 140 individuals B. 76 individuals C. 70 individuals D. 142 individuals
Mathematics
Graph.25x2 - 9y2 = 225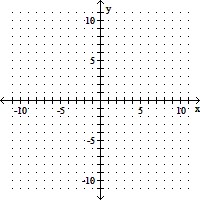
A. 
B. 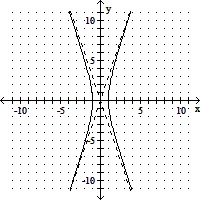
C. 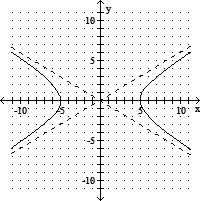
D. 
Mathematics